Quant Fun
Ten Years or Two Weeks? What a Backtest Length Really Measures
Calendar time is a poor measure of evidence. Effective sample size, overlapping signals, regime coverage, and the number of variants you tried decide whether a backtest tells you anything at all.
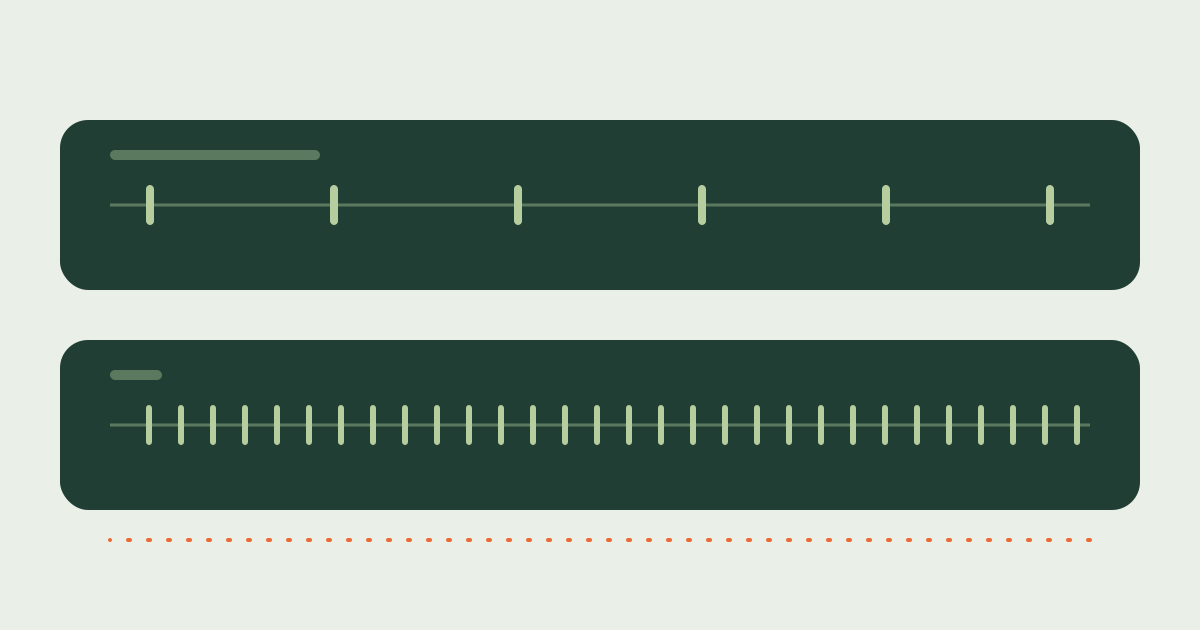
Which would you trust: ten years, or two weeks?
Two strategies are put in front of you. One has ten years of history. The other has two weeks. Almost everyone picks the decade without thinking about it, and for a moment that seems obviously right.
Then count what each test actually produced. A strategy that trades once a week made about 520 decisions in those ten years. A strategy working on a one-minute horizon passed through roughly twenty thousand minutes in a fortnight. Calendar length measures how long you waited. It does not measure how much the data told you.
The naive fix—counting observations instead of years—is wrong in the other direction. Twenty thousand minutes are nowhere near twenty thousand independent facts. The quantity that matters is the effective sample size: how many genuinely independent pieces of information a test contains. Both numbers above are misleading, and the interesting work is in the gap between them.
What actually counts as an observation
An observation is worth something only to the extent that it could have surprised you independently of its neighbours. Minutes fail that test constantly. Volatility clusters, so a busy minute predicts a busy minute. Order flow is autocorrelated. One piece of news colours an hour. A position held for twenty minutes overlaps with every decision made inside it.
Overlapping windows are the most common way to inflate a sample without adding anything to it. If a feature averages the last sixty minutes and you sample it every minute, consecutive values share fifty-nine sixtieths of their input. The count grows sixtyfold; the information does not. The same happens across a lifecycle: many fills in one market during one move are one bet reported many times.
Lo’s analysis of Sharpe-ratio statistics makes the direction of the error explicit. The familiar standard error assumes independent, identically distributed returns; under positive serial correlation the true standard error is larger than that formula suggests. The same Sharpe ratio, computed on the same number of rows, then carries less evidence than the row count implies.
Research: the statistics of Sharpe ratios — Andrew Lo
Explore this topic
Where the fast strategy genuinely wins
Apply that deflation honestly and the fast strategy usually still wins the count. Suppose only a small fraction of those minutes carry independent information. A fortnight can still deliver thousands of effectively separate opportunities. Ten years of weekly decisions cannot deliver more than about five hundred, no matter how the arithmetic is arranged.
The fast test also wins on what you can do with it. You can hold out a block of time and still have enough left to learn from. You can split results by hour of day, by volatility regime, by asset, by venue, and ask whether the effect is present everywhere or living in one pocket. A weekly strategy with a decade of history has nothing to split: every subset is noise.
And it wins on falsification speed. A minute-horizon strategy that has stopped working says so within days. A weekly strategy takes years to reject, which means you can spend a large part of a career being wrong about it politely.
What speed cannot buy you
Regime coverage. Two weeks contains two weeks of market conditions. A fast test can have enormous statistical power inside the regimes it saw and say nothing at all about a crisis, a liquidation cascade, a venue outage, a fee change, or a structural shift in who is providing liquidity. More observations is not the same claim as more robust.
This is where the slow test earns its place. Ten years of weekly decisions is weak evidence about an average, but it is real evidence about survival: it lived through conditions a fortnight cannot contain. The two tests answer different questions, and the strongest evidence—many effectively independent observations spread over several distinct regimes—is usually the thing you cannot have yet. Say which one you have.
Costs are the other thing speed does not buy. A fast strategy’s edge per trade is small, so fee and slippage assumptions dominate the result; a few basis points of optimism about fills can flip the sign of a year’s work. A short-horizon backtest needs realistic execution modeling more than a slow one does, not less.
Explore this topic
The leak nobody counts: how many strategies did you try?
Evidence is also spent by searching. If you run two thousand variants and keep the best, that survivor’s t-statistic is not the t-statistic of one experiment. The expected maximum of many independent trials grows on its own, with no signal anywhere in the data. Harvey, Liu, and Zhu make the same argument about published asset-pricing research: once you account for how many factors have been tried, the significance hurdle for a new one has to rise substantially.
The practical discipline is dull and effective. Decide how many variants you will run before you run them. Keep a period you have never looked at. Treat the winner of a wide sweep as a hypothesis to be tested on new data, not as a result. And notice that a short archive combined with a large search manufactures beautiful Sharpe ratios out of pure noise—the two failure modes compound.
Research: multiple testing and the cross-section of expected returns — Harvey, Liu, and Zhu
Explore this topic
How to read a backtest with this in mind
Studio’s replay reports more than a profit figure for exactly this reason: fills, markets, the equity curve, maximum drawdown, the maker and taker split, fees, and the recorded data behind the run. Read the count of genuinely distinct situations, not the number of rows. A result carried by one market during one move is a single observation wearing a crowd’s clothing, and the report gives you enough to notice that.
The recurring theme is worth stating plainly: a backtest is not about how much data you have. It is about how much independent information that data contains. Calendar time is the easiest thing to report and the least informative thing to trust.
Explore this topic