Quant Fun
500 Stocks Are Not 500 Experiments
Breadth across assets is the easiest way to overstate evidence. Why a market mode, sectors, and styles collapse a large universe into a handful of independent directions—and what that does to your t-statistic.

“I tested it on 500 stocks”
It sounds like 500 experiments. It is not. On a day when the market falls three percent, most of those names fall together, and your five hundred results are five hundred views of the same event. Breadth across assets is the easiest way to make a thin result look thick.
The crypto version is worse, not better. A universe of forty tokens shares a dominant driver so strong that on many days the cross-section is essentially one number plus noise. Whatever your signal is, if it is long-biased it was partly measuring that one number.
The market comes out first
Look at the correlation matrix of a large equity universe and one direction dominates: a mode in which nearly every name participates together. Plerou and co-authors, applying random matrix theory to cross-correlations, identify that largest component with the market itself, and show that a small number of further components carry genuine structure while the rest are statistically indistinguishable from noise.
Laloux, Cizeau, Bouchaud, and Potters make the companion point about estimation: most of the empirical correlation matrix of a large universe is compatible with random noise given the amount of data available. You are usually estimating far more pairwise correlations than you have independent observations to support, which is its own reason to distrust a cross-sectional result.
Remove the market component and what remains are residuals—not stocks. That distinction matters more than it sounds. Residuals have different properties, less predictable structure, and far less of the persistent drift that made the raw series look tractable. A signal that worked on raw returns and dies on residuals was, at least in part, a market-timing signal wearing a cross-sectional costume.
Research: noise dressing of financial correlation matrices — Laloux, Cizeau, Bouchaud, and PottersResearch: a random matrix approach to cross-correlations — Plerou and co-authors
What is left is still not independent
After the market, the obvious structure does not stop. Sectors move together. So do styles: size, value, momentum, quality, and whatever the current fashion calls the same things. Add rate sensitivity, liquidity, index membership, shared supply chains, common ownership, and crowding into the same trades by people running similar models.
Fama and French’s work is the familiar version of this: a few common factors explain a large share of the variation in a broad cross-section of returns. You can argue about which factors are real; you cannot get from there to five hundred independent series.
So the honest number of independent directions in a 500-name universe is far below 500. There is no universal constant to quote here—it depends on the universe, the period, and the horizon—and it is worth resisting the temptation to invent one. What is reliable is the direction of the error and its size: the gap is usually an order of magnitude, and it narrows exactly when you least want it to, because correlations rise in a crisis. The moment your positions need diversity most, your evidence has least.
Research: common risk factors in stock and bond returns — Fama and French
What that does to your t-statistic
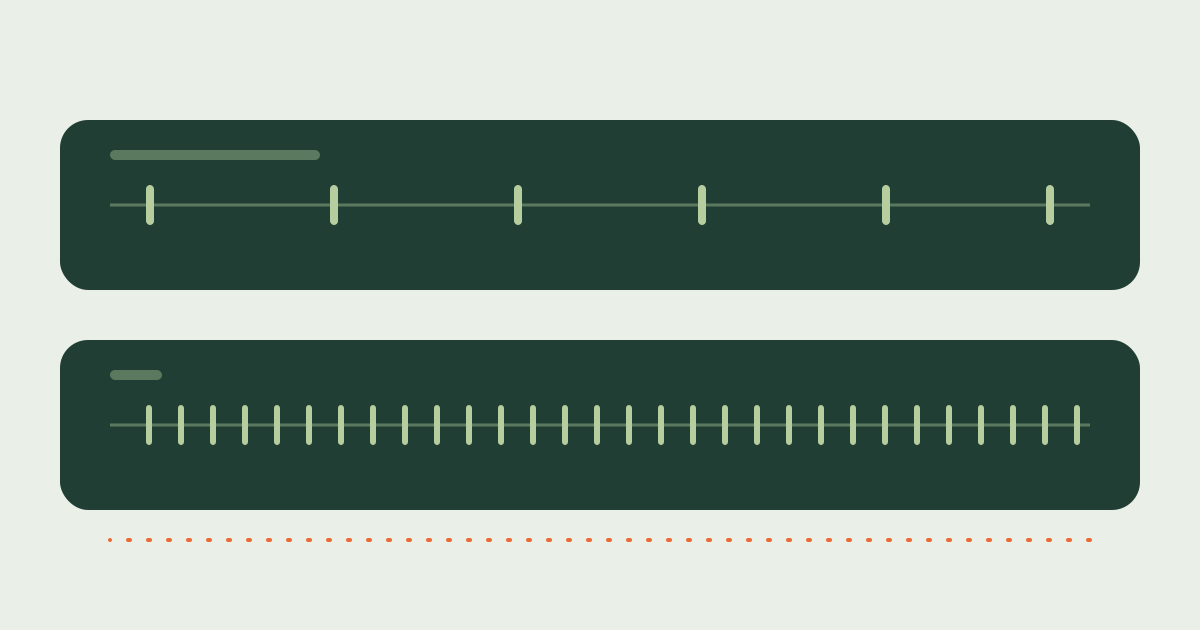
Average a signal’s returns across a universe and the standard error you compute depends on how many independent things you averaged. Treat 500 correlated names as 500 independent draws and the error shrinks by the square root of 500 when it had no right to.
The arithmetic of the correction is unforgiving. A result reported as t = 4 under the assumption of 500 independent names falls to roughly t = 1 if only about thirty of those names move independently. Nothing about the strategy changed; only the honesty of the denominator did. This is invented arithmetic to show the mechanism, not a measurement of any particular strategy.
Working out how many independent units you actually have is a real piece of work—it comes out of the correlation structure of the period you actually tested, not from the number of tickers in your list, and Quant Fun treats it as part of evaluating an experiment rather than a number to advertise. The part worth internalizing is simpler: the denominator is a modeling choice, and choosing it carelessly is how a backtest lies to you politely.
Explore this topic
Not only a retail problem
A fund holding positions in hundreds of instruments may still be running a handful of bets. Low correlation to an index is a statement about a sample period, not a structural property; books that looked diversified for years have discovered during a single stressed week that they held one position in many costumes. The diversification was in the position list, not in the risk.
The same reasoning deflates a long-only tracking product’s record from the other side: almost all of its variance is the market mode you could have bought directly, so its history is mostly evidence about the market, and only faintly evidence about the manager.
Explore this topic
Designing a cross-sectional test honestly
None of this says breadth is worthless. Breadth is genuinely valuable—it is the reason cross-sectional strategies can work at all—but it has to be counted at its true weight. A practical checklist looks like this.
The same discipline applies to a crypto universe, where the dominant mode is stronger and the number of independent directions is smaller than in equities. Selecting more assets in Studio widens the candidate set; it does not multiply your evidence. What multiplies evidence is independence, and independence is something you measure rather than something you assume.
- Neutralize the obvious common factor before you measure anything, and say in the write-up that the result is a residual result.
- Report per-sector, per-asset, and per-regime breakdowns—a signal living in one sector is one observation, however many names carry it.
- Re-estimate the correlation structure inside the test period rather than reusing a number from a calm year.
- Treat universe size as a hypothesis about independence, not as a sample size, and keep an out-of-sample block you have never inspected.